Customer Perception Analysis & Maps
Download PDF here: Customer Perception Of Safey and Risk

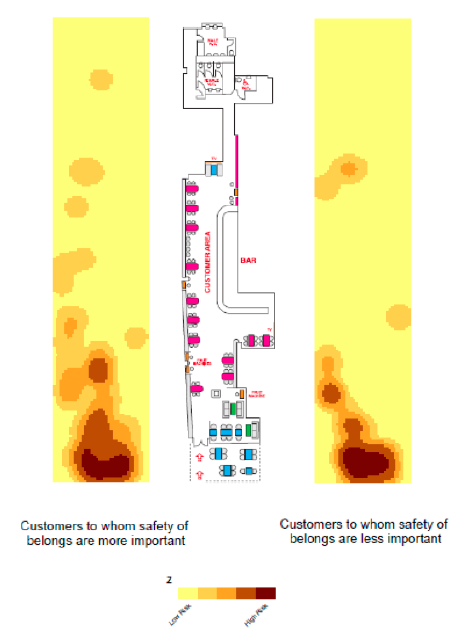
As part of the customer survey, participants were asked to mark on a floor plan locations that they thought were particularly risky in terms of the possibility of bag theft. In the bar featured below (Moon Under Water, Leicester Square), there were 27 respondents who indicated their thoughts on risky locations. These locations were geocoded (digitally located in space) using a Geographic Information System using the digital layout of the bar produced by Spike Spondike at Central St Martin’s college. The locations were then submitted to the crime mapping software CrimeStat III which produces a kernel density plot of risk using the individual responses. In this case, the bar was split into a grid of 40 columns, and the bandwidth used was 1.5 meters. Kernel density estimation is the extrapolation of data from a sample to an entire population. In mapping, this involves the production of a smoothed hotspot from individual discrete points. The bandwidth and cell size determine the extent of and degree of smoothing of the risk surface produced. For more information see Chainey and Ratcliffe (2005).
